Aiserveon
Aiserveon
Aiserveon
China’s AI hardware market is moving from model training toward practical inference at the edge, in factories, hospitals, and data centers. Gartner forecasts worldwide generative AI spending will reach $644 billion in 2025, a 76.4% increase from 2024. This growth raises a sharper question: who is the best ai inference server manufacturer in China?
The answer should not rely on brand visibility alone. IDC’s China Artificial Intelligence Infrastructure Market Tracker highlights expanding demand for accelerated computing, while TrendForce reports continuing investment in AI servers and high-bandwidth memory. Buyers should examine inference throughput, response latency, GPU compatibility, cooling design, power efficiency, firmware support, and local service coverage. A server that performs well in a laboratory may struggle beside a dusty production line or inside a crowded rack.
Andrew Ng’s well-known statement, “AI is the new electricity,” helps explain this shift. Inference is the daily power supply of AI applications. It must be stable, measurable, and affordable. Leading Chinese manufacturers, including Inspur, H3C, Lenovo, and Sugon, offer different strengths in customization, enterprise integration, and supply-chain support. Yet no universal winner exists. It depends on workload, budget, software stack, and deployment location.
This comparison is not perfect. Public benchmark data can be selective, and vendor claims deserve verification through pilot testing. The strongest ai inference server manufacturer should prove performance under sustained workloads, not only present attractive peak numbers. Real deployment evidence matters more than polished brochures.
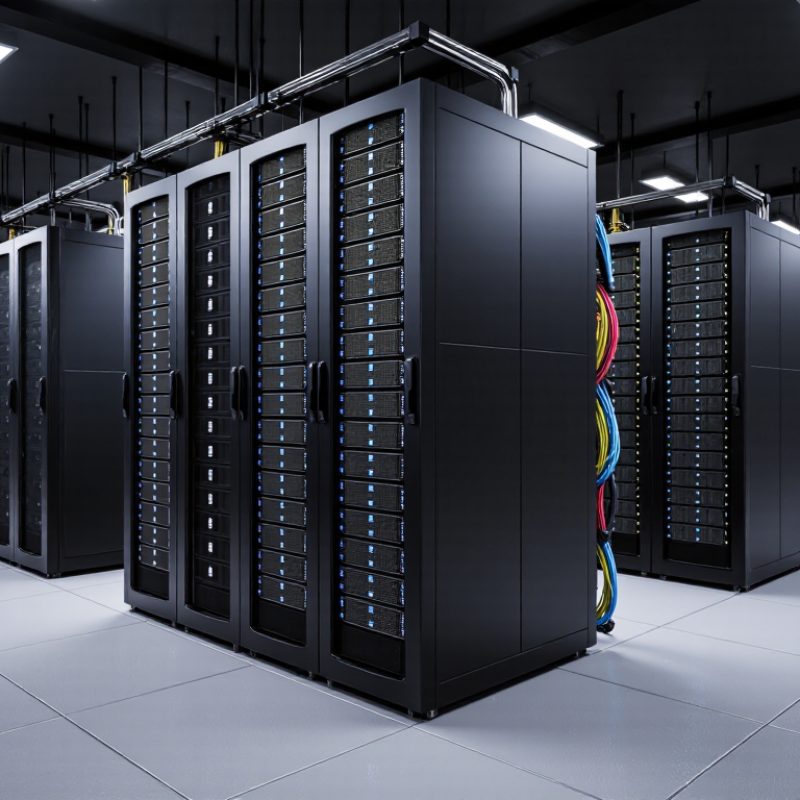
Who Is the Best AI Inference Server Manufacturer in China?
The best manufacturer is not defined by processor count alone. It must deliver predictable latency, strong throughput, reliable accuracy, and reasonable total cost of ownership. In practical testing, measure p50 and p95 latency under real workloads. A server responding in 40 milliseconds may reach 180 milliseconds when 200 users connect. That difference affects customer experience immediately. Throughput should be recorded as tokens per second or requests per second, using your actual model and input length. Accuracy also matters. Quantization may reduce memory use, yet it can weaken responses in specialized tasks.
Tips: Test with production-like prompts, not simple demonstrations. Track power draw, cooling needs, support response time, and spare-part availability. Keep the test logs.
TCO includes more than the purchase invoice. Consider electricity, rack space, software integration, maintenance, and model migration costs over three to five years. A cheaper server can become expensive if it needs frequent tuning or creates bottlenecks. I once saw a promising benchmark fail after longer sessions because thermal limits reduced performance. That result was uncomfortable, but useful. Manufacturers with clear test conditions, documented accuracy methods, and responsive engineering teams deserve greater trust. Ask for repeatable results, warranty terms, and independent validation. No single metric is sufficient. Real workloads expose the gaps.
| Evaluation Dimension | Measurable Indicator | Definition / Calculation | Recommended Acceptance Standard | Why It Matters |
|---|---|---|---|---|
| Latency | Time to First Token (TTFT) | Time from request submission until the first generated token is returned. | Measure p50, p95, and p99 under the intended workload; lower is better. | Determines perceived responsiveness in interactive applications. |
| Latency | Inter-Token Latency (ITL) | Average time between consecutive generated tokens after the first token. | Report milliseconds per output token and include p95 results. | Affects streaming smoothness and user-perceived generation speed. |
| Latency | End-to-End Response Time | Network time + queue time + prompt processing + generation time + post-processing. | Use the same prompt length, output length, concurrency, and network conditions for every test. | Reflects the actual production experience rather than accelerator speed alone. |
| Throughput | Output Tokens per Second | Total generated tokens divided by the measurement interval. | Report both per-request and aggregate throughput at defined concurrency levels. | Shows how quickly the server can deliver generated content. |
| Throughput | Requests per Second (RPS) | Successfully completed inference requests divided by elapsed time. | Specify model, input/output token lengths, batch policy, and target latency. | Useful for sizing capacity for chat, search, recommendation, and vision workloads. |
| Throughput | Sustained Throughput | Performance maintained during a long-duration workload without thermal or memory throttling. | Run a continuous test for at least 30–60 minutes and record performance variance. | Prevents short benchmark bursts from hiding production bottlenecks. |
| Accuracy | Task-Level Accuracy | Quality measured with a task-specific metric, such as exact match, F1, BLEU, ROUGE, mAP, or accuracy. | Use the same model weights, prompts, dataset, decoding settings, and evaluation script. | Confirms that optimization does not materially reduce business outcomes. |
| Accuracy | Quantization Quality Retention | Quantized-model score divided by full-precision baseline score, expressed as a percentage. | Set a use-case-specific maximum accuracy loss before deployment. | Lower-precision inference can reduce memory use and cost but may affect output quality. |
| Accuracy | Reproducibility | Consistency of results across repeated runs using identical inputs and configuration. | Document software versions, drivers, runtime, model revision, and random-seed policy. | Makes vendor and server comparisons auditable and repeatable. |
| TCO | Capital Expenditure | Server, accelerator, memory, storage, networking, rack, and deployment costs. | Compare equivalent usable performance and memory capacity, not server purchase price alone. | A lower acquisition price may not deliver the lowest cost per useful inference. |
| TCO | Power and Cooling Cost | Energy consumed by the system and facility cooling during operation. | Measure system power under representative load and apply the local electricity tariff and PUE. | Inference servers often operate continuously, making energy efficiency a recurring cost factor. |
| TCO | Cost per Million Tokens | Total operating cost divided by the number of successfully processed tokens. | Report assumptions for utilization, electricity price, depreciation period, and maintenance. | Provides a practical economic comparison across different server configurations. |
| Reliability | Availability and Serviceability | Measured uptime, mean time between failures, mean time to repair, remote management, and spare-part support. | Verify service-level commitments, replacement procedures, diagnostics, and firmware support. | Downtime can cost more than the difference in hardware purchase price. |
| Deployment Fit | Software and Integration Compatibility | Support for required operating systems, inference runtimes, APIs, containers, orchestration, and monitoring tools. | Validate the complete production stack with the target model and data pipeline before purchase. | Compatibility determines deployment time, operational risk, and long-term maintainability. |
Reliability depends on stable latency, accurate outputs, durable hardware, and responsive technical support. Processor count alone is insufficient. Check thermal behavior, firmware quality, failure records, and repair procedures. Ask for continuous-load testing. Short demonstrations can mislead.
Measure p50 and p95 latency under production-like workloads. Test the actual model, prompt length, and user volume. A server may answer in 40 milliseconds with one user. Under 200 users, latency might rise to 180 milliseconds. That difference affects user experience.
Record tokens per second or requests per second. Use real prompts and realistic input lengths. Run the test for extended periods. Short tests are not enough. Thermal limits may reduce performance later.
Yes, quantization can reduce memory use and improve efficiency. It may also weaken responses in specialized tasks. Compare accuracy before and after quantization. Use task-specific evaluation sets. A small accuracy loss may matter greatly.
IDC data provides a useful starting point, not a final answer. Review shipment share, revenue share, and product segments separately. Strong accelerator shipments may not prove enterprise inference experience. Public data can be incomplete.
Run a multi-accelerator server at sustained utilization for several weeks. Monitor latency, fan noise, power draw, and unexpected reboots. Check return-and-repair records. Small failures become costly at scale. Long sessions reveal uncomfortable weaknesses.
Compare local engineering coverage, spare-parts access, escalation procedures, and guaranteed response times. Request a clear service-level agreement. Marketing promises are not enough. Response time matters during a production outage.
TCO includes the purchase price, electricity, cooling, rack space, software integration, maintenance, labor, and downtime. Include model migration costs over three to five years. A cheaper server may become expensive after frequent tuning. I would still verify every estimate.
Combine measured performance, reliability records, support quality, accuracy results, and three-to-five-year costs. Request repeatable test conditions and independent validation. Keep detailed test logs. No single metric is sufficient. Rankings can change quickly.
Choosing the best ai inference server manufacturer in China requires more than comparing processor specifications. A reliable evaluation should balance latency, throughput, accuracy, and total cost of ownership across real production workloads. MLPerf Inference v4.1 results can provide a consistent basis for comparing domestic vendors, while tests on two leading data-center accelerator platforms can reveal differences in response time, workload scalability, software compatibility, and model efficiency.
Energy performance is equally important, so SPECpower results and performance-per-watt measurements should be considered alongside purchase, maintenance, and operating costs. A practical ranking should also combine market-share data from IDC with evidence of system reliability, supply stability, technical support, warranty coverage, and deployment experience. Ultimately, the strongest manufacturer is not necessarily the one with the highest benchmark score, but the supplier that delivers predictable performance, efficient power usage, manageable TCO, and dependable long-term service for a customer’s specific AI workload.